
Statistics
Click the chart icon in the toolbar to open your collection statistics. Click the back arrow to return to your list.
Summary Tiles
The top of the page always shows:
| Tile | What it counts |
|---|---|
| Bottles owned | Sealed and opened bottles tagged Collection or Extra, counting each bottle of a quantity |
| Opened | How many of those bottles are opened |
| Total spend | The sum of prices for bottles you own (price × quantity) |
| Est. value | The sum of current values for owned bottles that have one (value × quantity). Underneath: how many bottles are valued, and the gain or loss against what those same bottles cost. The gain only shows when every valued bottle has a price |
| Avg price | The average price per bottle, for owned bottles that have a price |
| Avg rating | The average rating of owned bottles that are rated |
| Wish list | Bottles tagged Wish List |
Statistics describe your shelf as it is now, so bottles marked Finished, Sold / Traded or Gifted are left out of every tile and report.
Summary Report
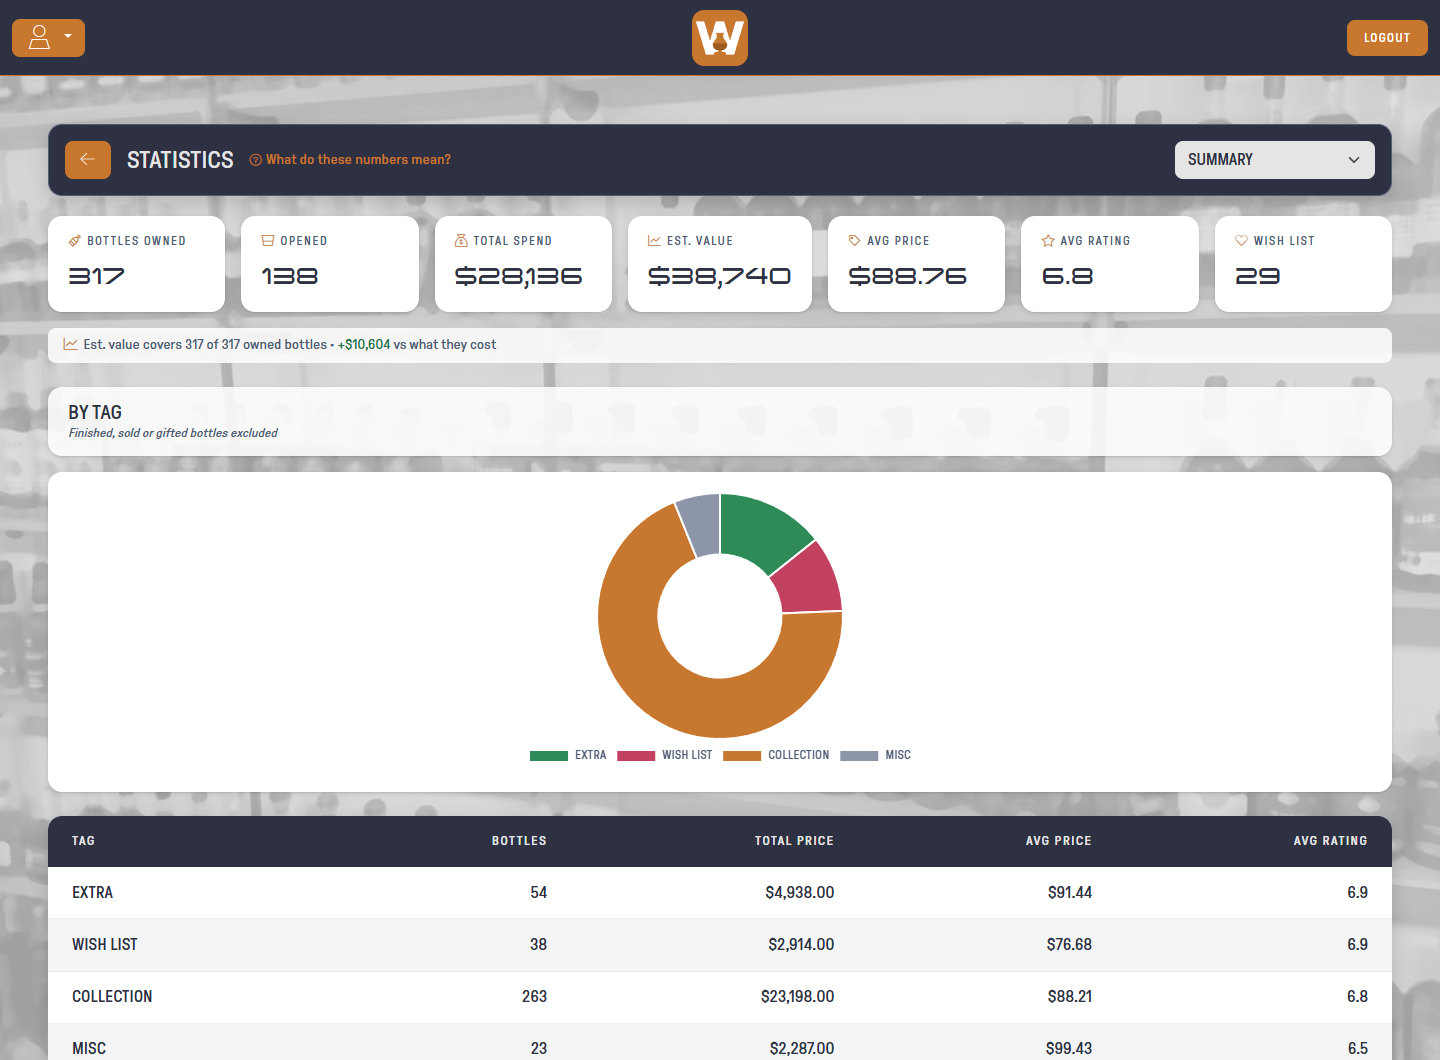
The default report breaks your whole collection down by tag, with a chart and a table of bottle count, total price, average price and average rating.
Distilleries, Types and Locations
Use the dropdown in the top-right corner to switch reports.
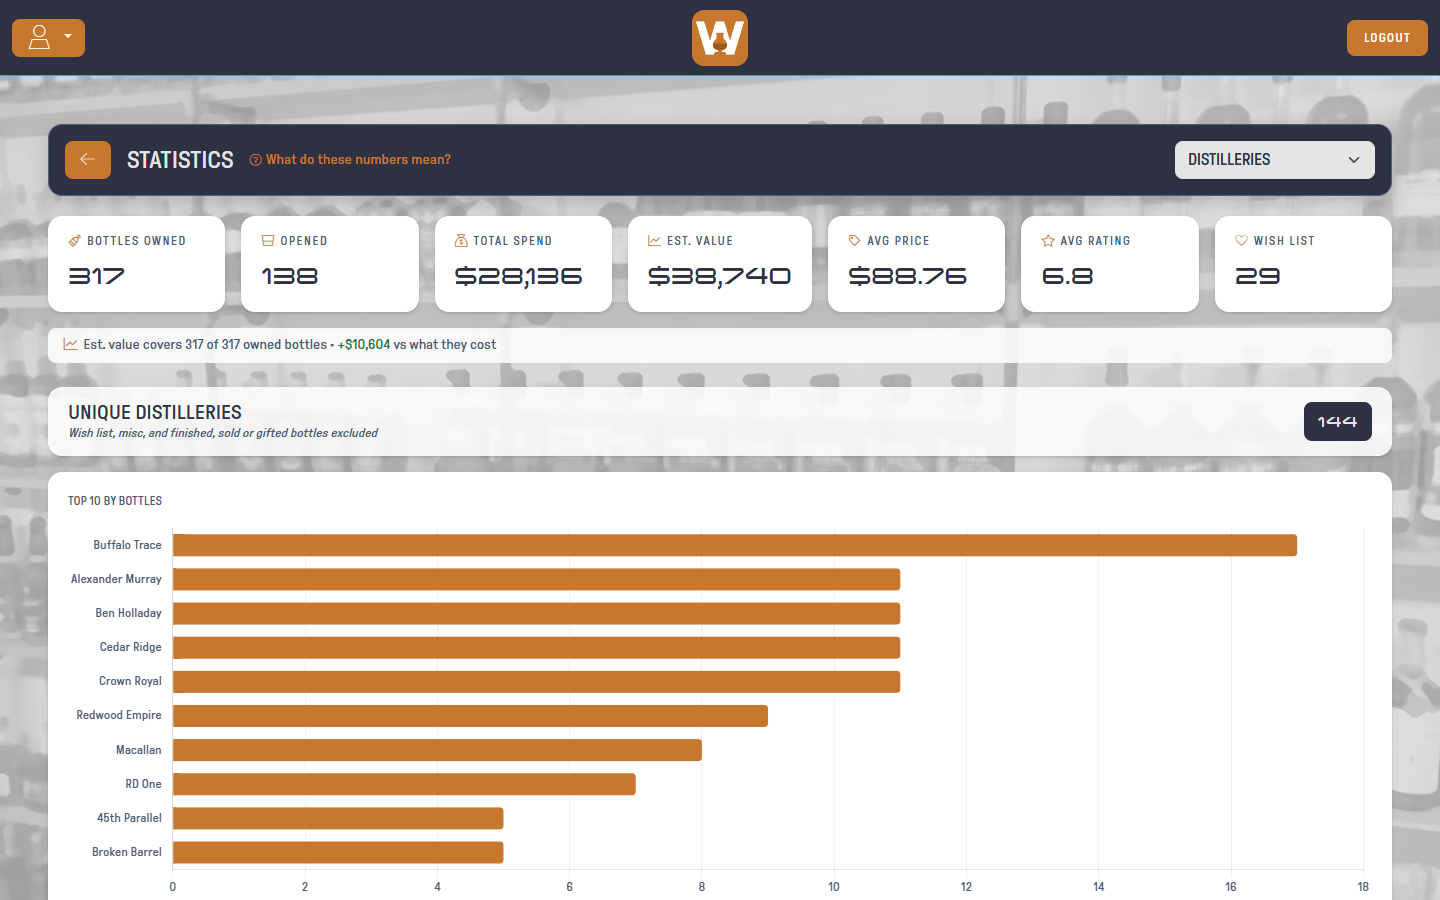
Each report shows how many unique distilleries, types or locations you have, a chart of the top 10 by bottle count, and a table with every one.
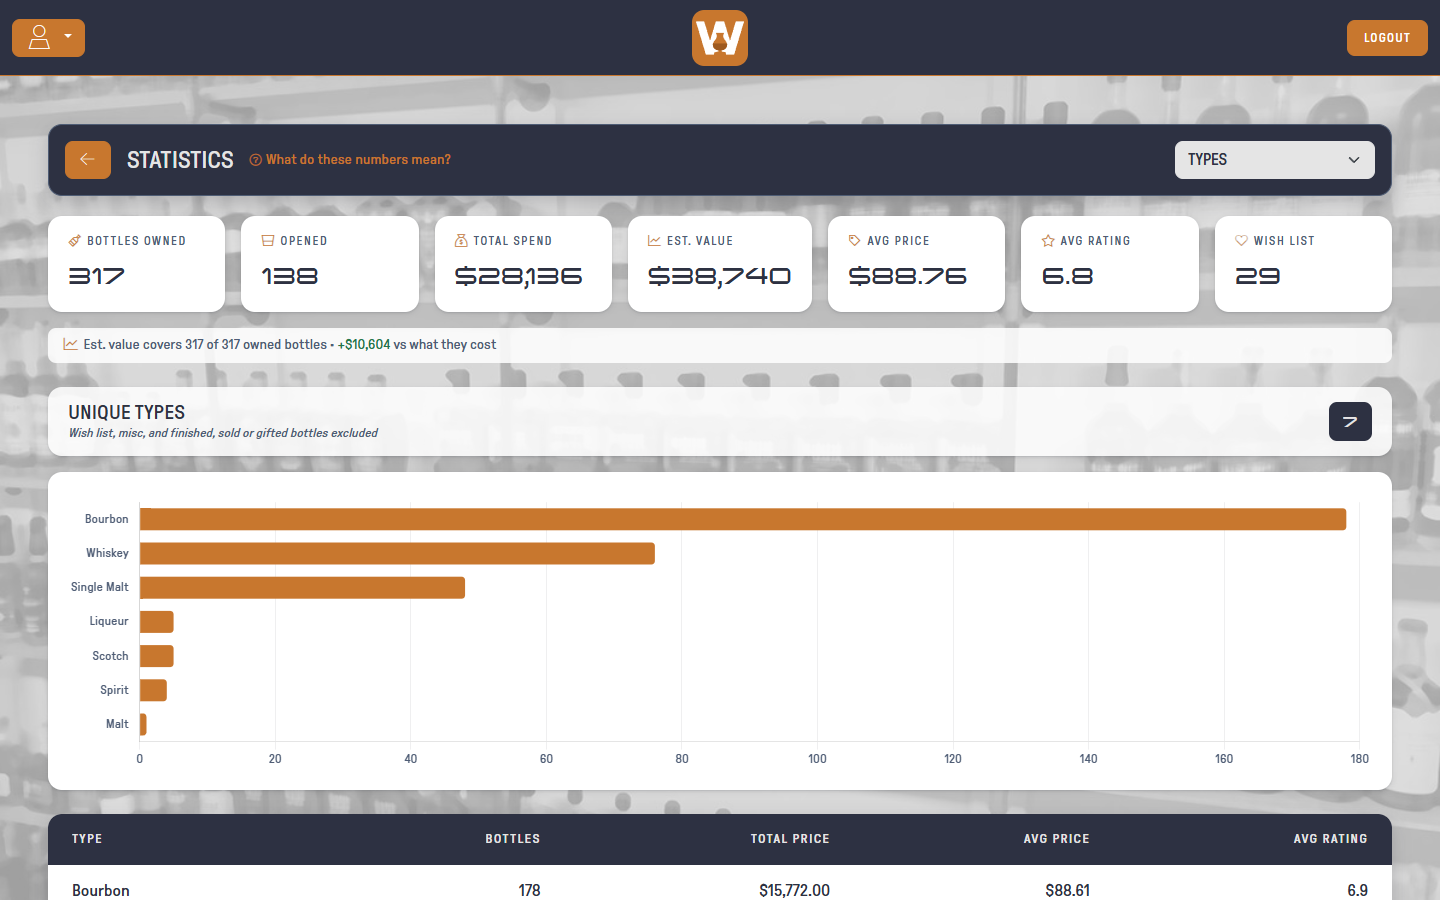
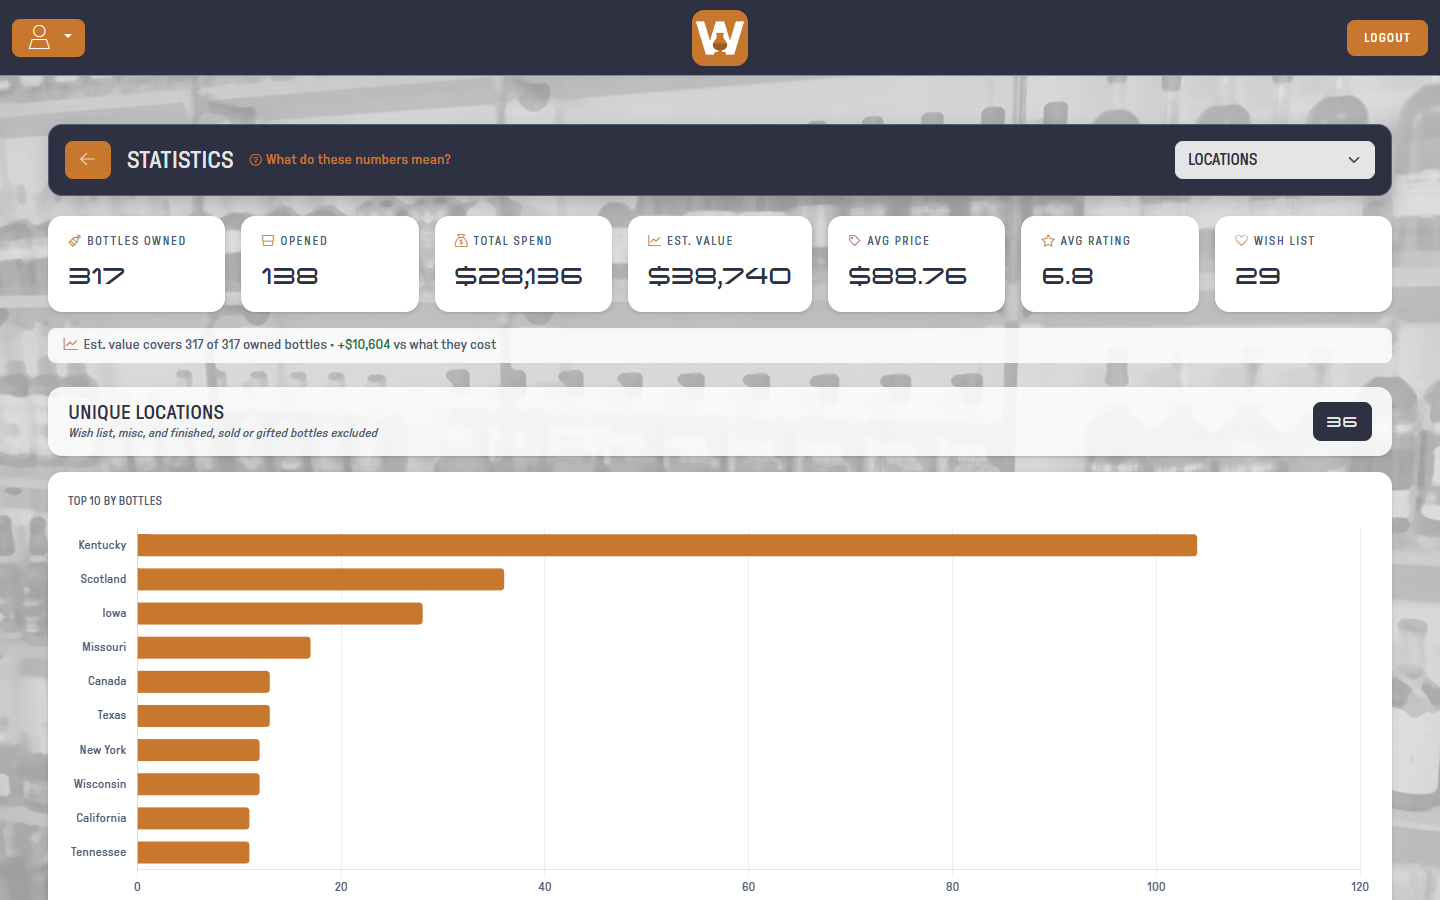
The distillery, type and location reports only count bottles you own. Wish List and Misc bottles are left out. Bottle counts include quantities, so a bottle with a quantity of 2 counts twice.